Karten / Maps
Die Stadt als Partitur. Zwölf Opern, zwölf Wege.
Aufbruch/Matt
How We Measure Intensity
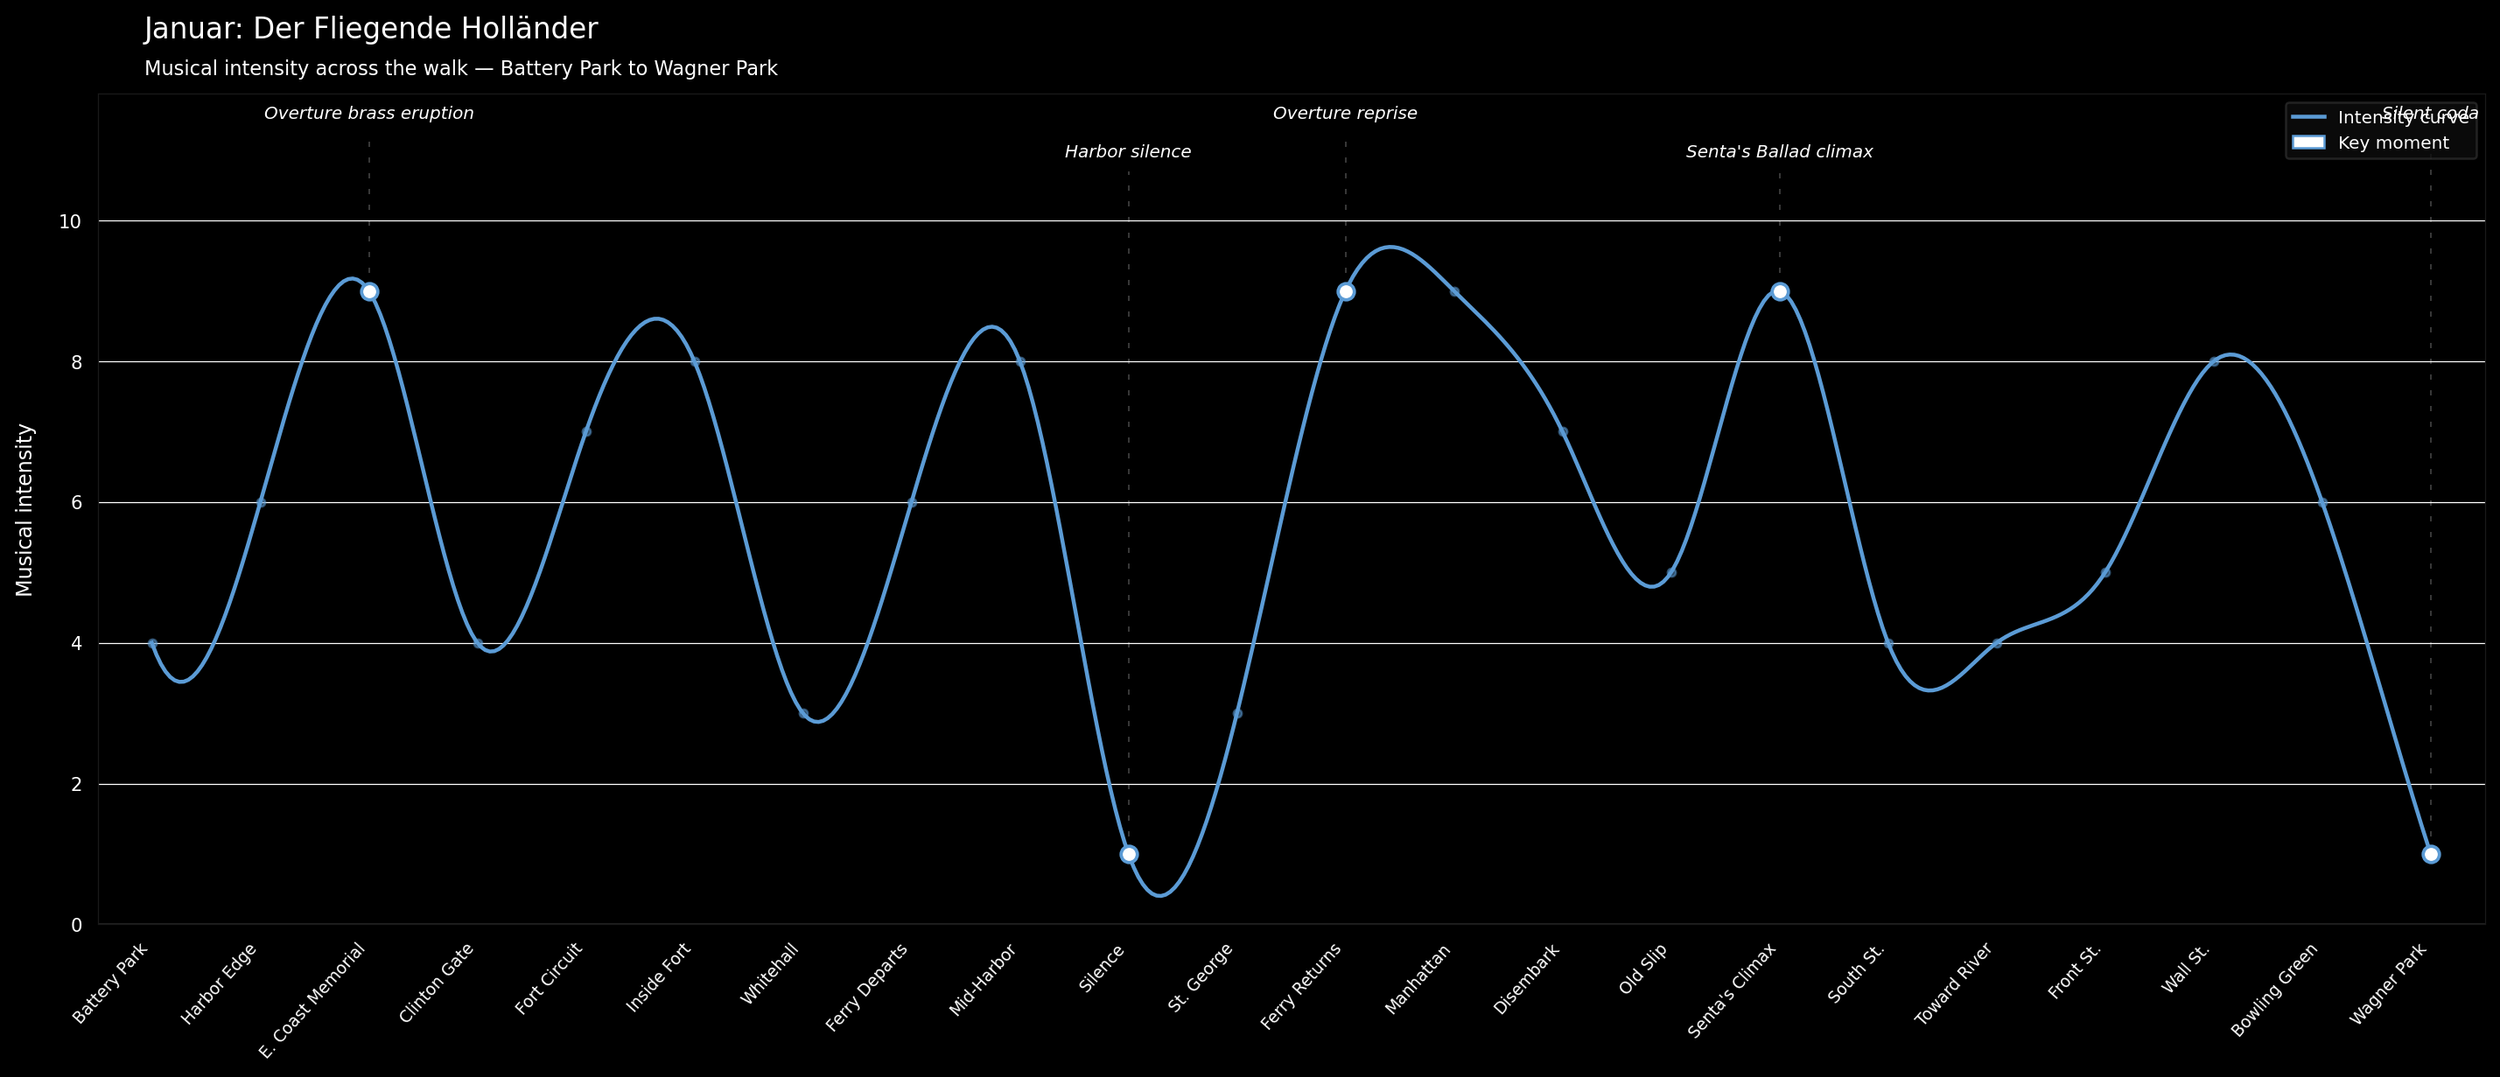
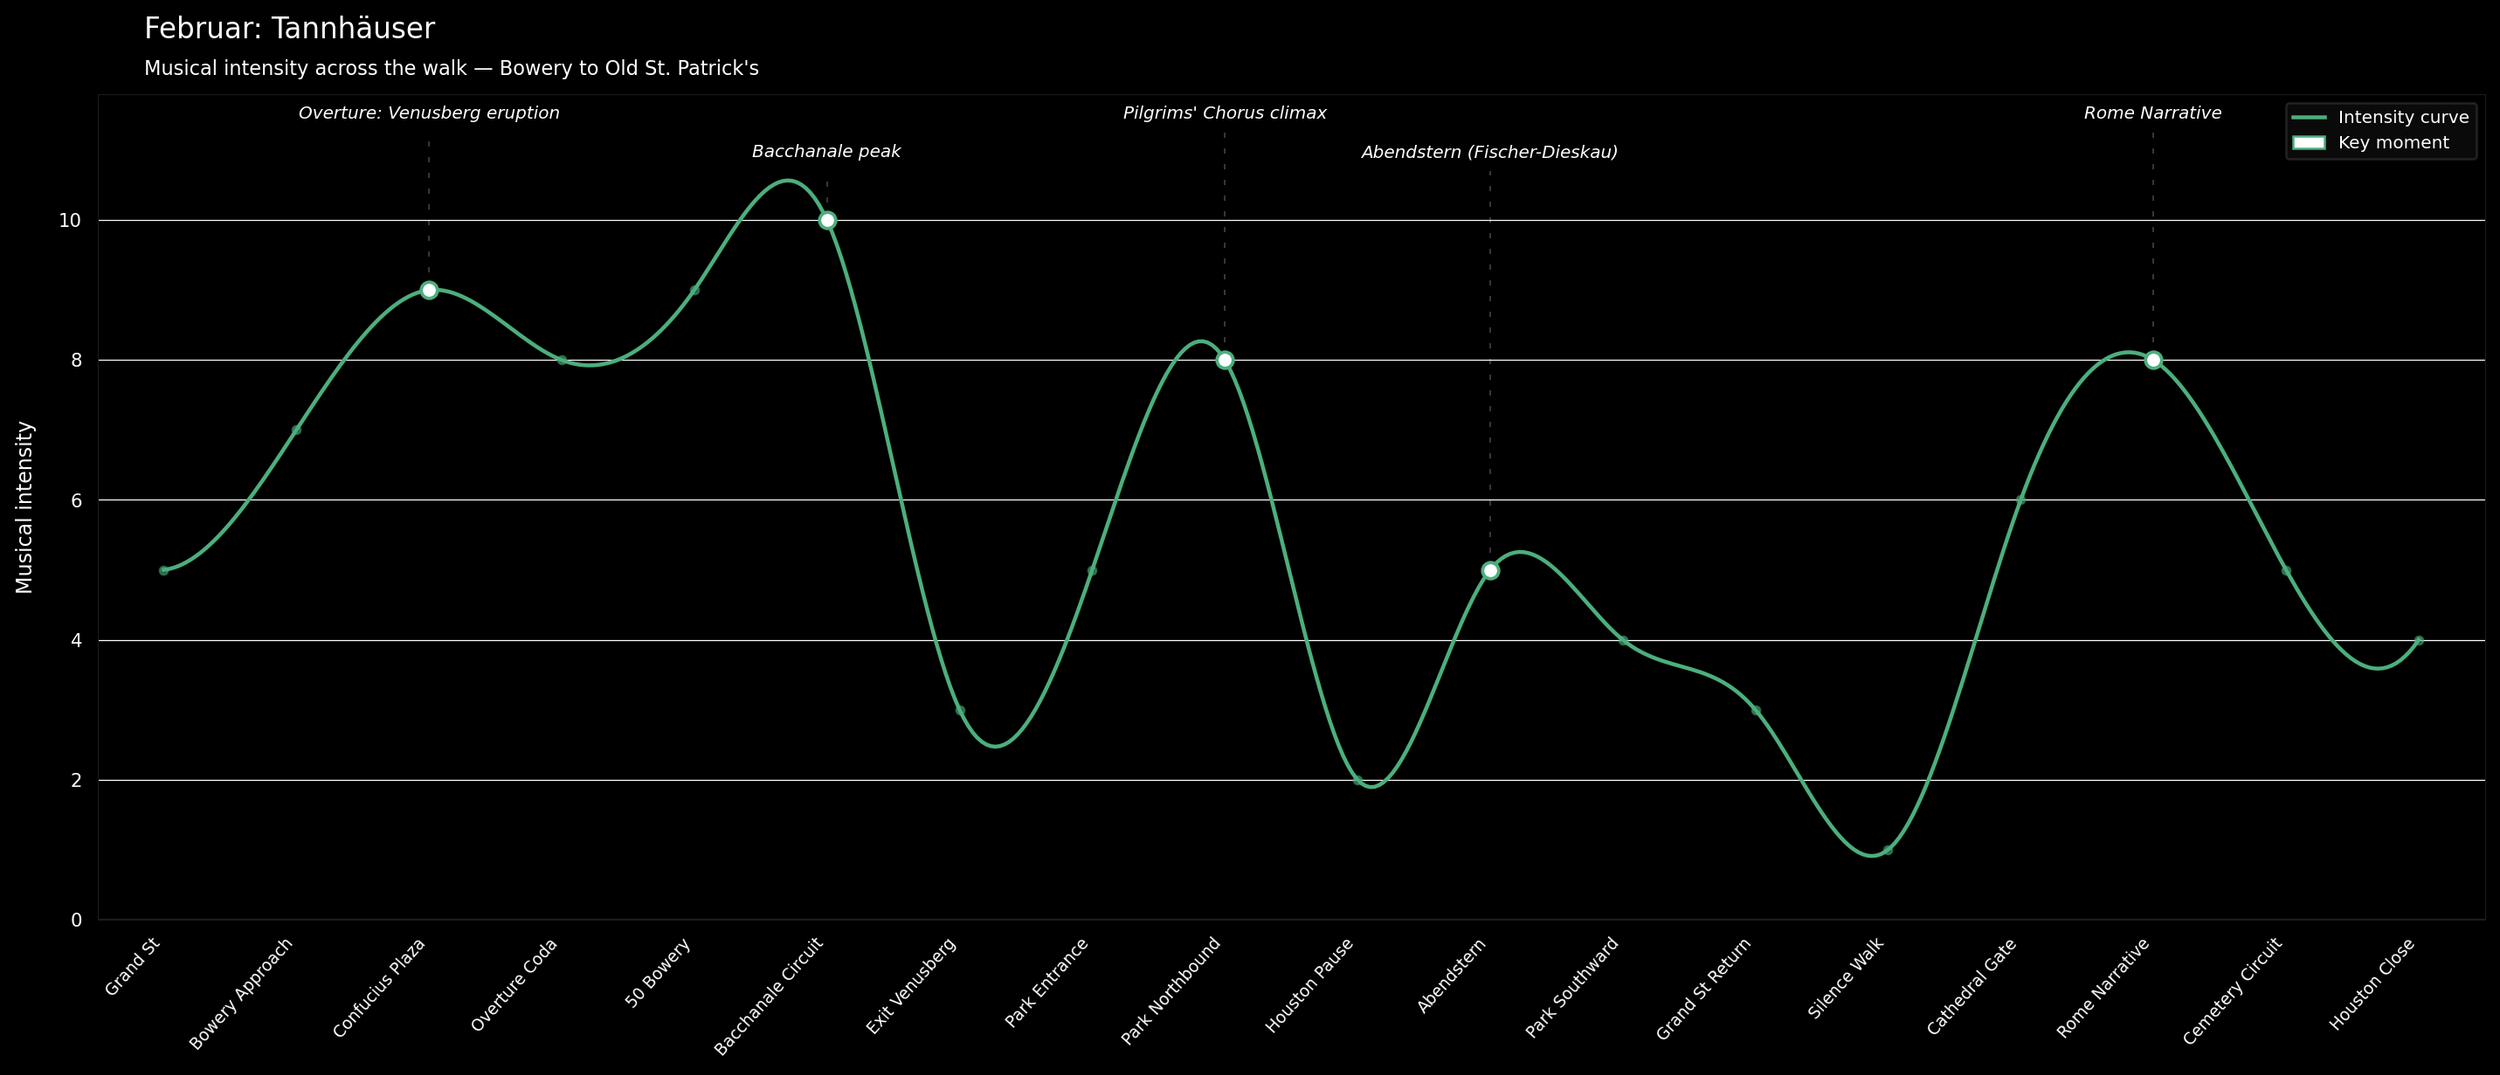
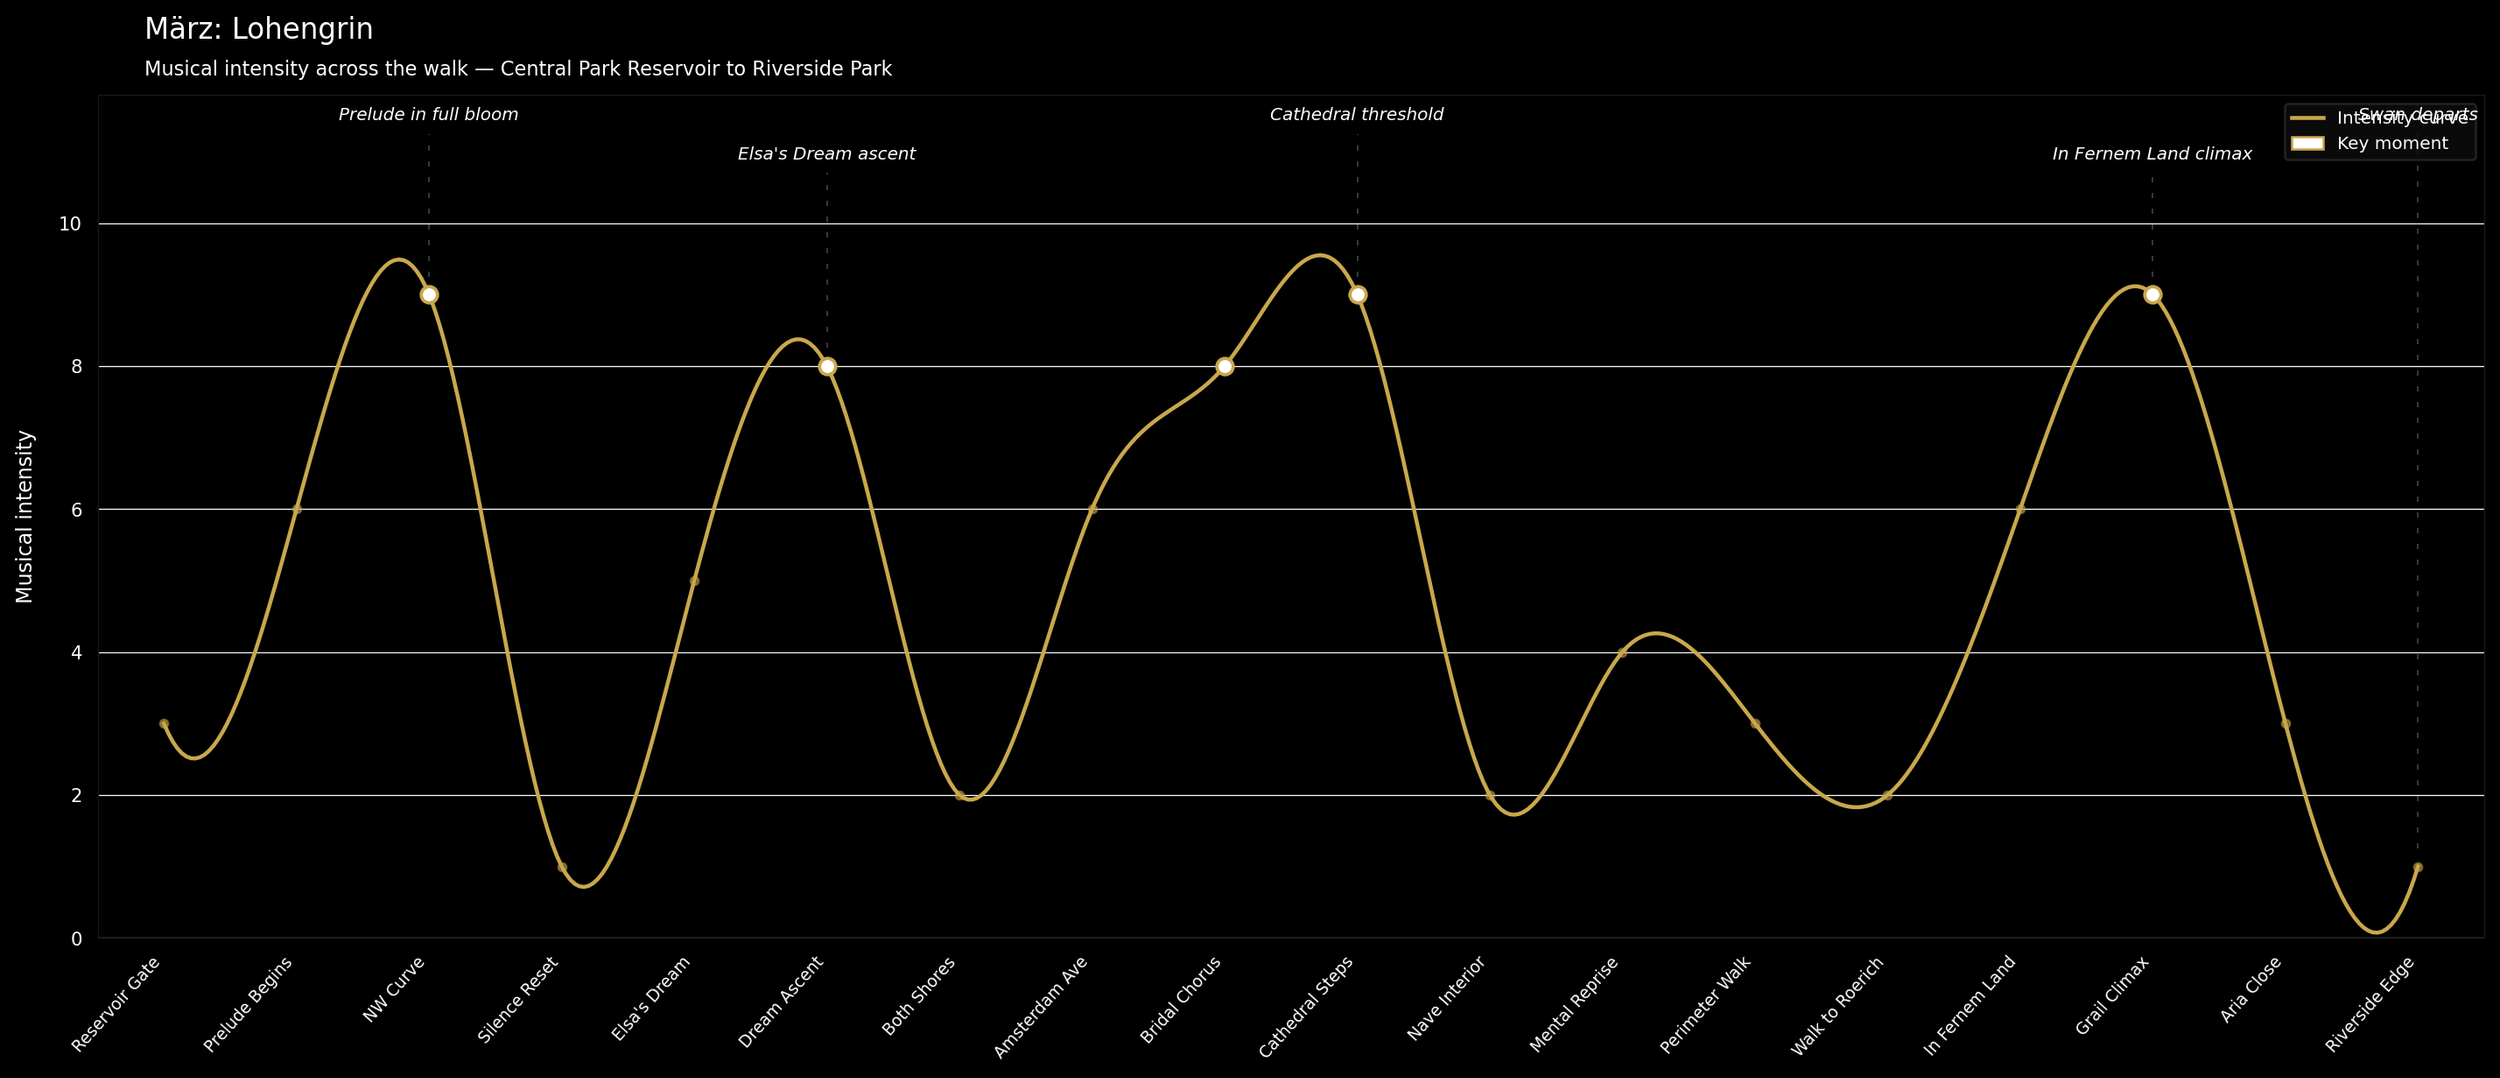
Each location in a walk is scored on a scale of 1 to 10 across five dimensions drawn from Wagner's own compositional practice: orchestral mass (the weight and density of the instrumentation at that moment), dynamic range (the spread from pianissimo to fortissimo), rhythmic urgency (the degree of forward propulsion versus suspension or stasis), harmonic tension (unresolved dissonance against cadential arrival), and dramatic register (the scale of the moment, from intimate soliloquy to full ensemble). These five scores are averaged into a single intensity value for each location.
The scoring is not purely musical. It is relational. A location earns its score based on the specific track assigned to it in the walk, and the particular moment within that track where the walker is instructed to listen. A piece of music that scores 9 in one context may score 4 in another if the walk calls for its quieter passage, its aftermath, or its deliberate silence. The chart maps experience, not the score in isolation.
Silence is scored too. When a walk instructs the walker to remove headphones, or to let music fade without replacement, those moments are assigned the lowest values on the scale. They are not absences in the data. They are structural. Wagner understood silence as compositional material, and these charts treat it the same way.
The Method
Each walk generates a sequence of scored locations which, when plotted and smoothed into a continuous curve, produces a shape that reflects the dramatic and musical arc of that month's opera. The x-axis represents the walk as it unfolds in time and geography, with each stop positioned sequentially. The y-axis represents intensity. The resulting line is not a transcription of the score. It is an interpretation of how the score lands in a specific body, moving through a specific city.
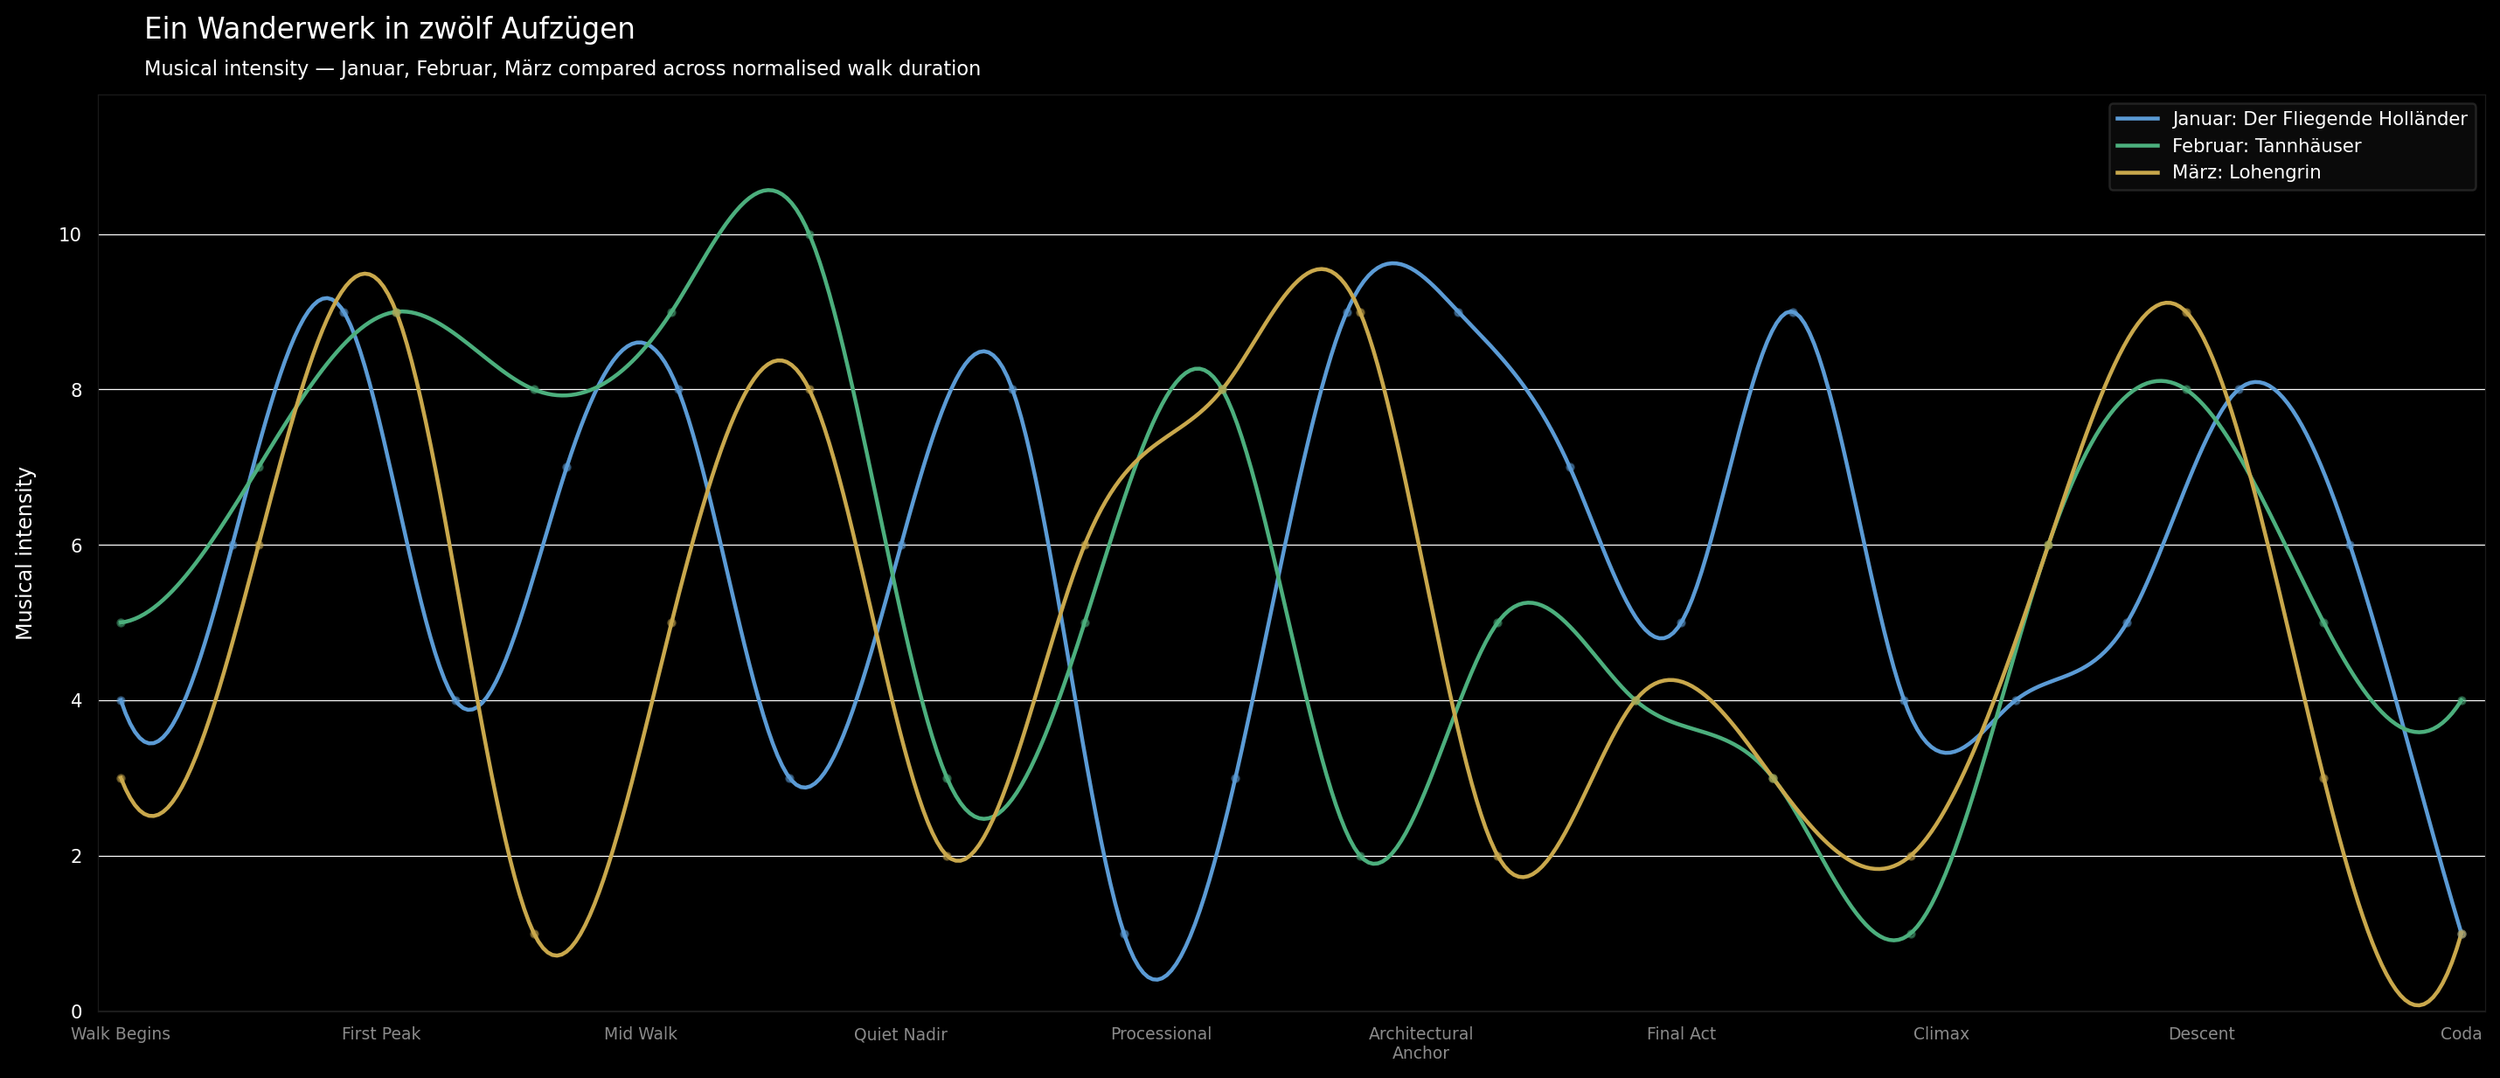
The combined chart places multiple walks on a normalised axis, compressing each to the same duration so their shapes can be read against one another. The individual walks have different numbers of stops, but their underlying logic. How they build, collapse, recover, and close, becomes visible as a comparative form. The three curves in the Q1 chart are not competing. They are consecutive propositions about what it means to move through New York with Wagner.