The Shape of the Walk: Mapping Wagner's Intensity Across the City
There is a question buried inside every walk this project makes. Not the question Elsa asks, or the question the Dutchman cannot stop asking, but a simpler and more stubborn one. What is actually happening to you when you move through a city with Wagner in your ears?
The walk guides assign specific music to specific locations. They tell you when to start a track, where to stand, what to look at. But they have never claimed to measure what the music does. That has remained implicit, gestural, a matter of phrasing and instruction. The intensity charts are an attempt to make that implicit structure visible.
The Five Dimensions
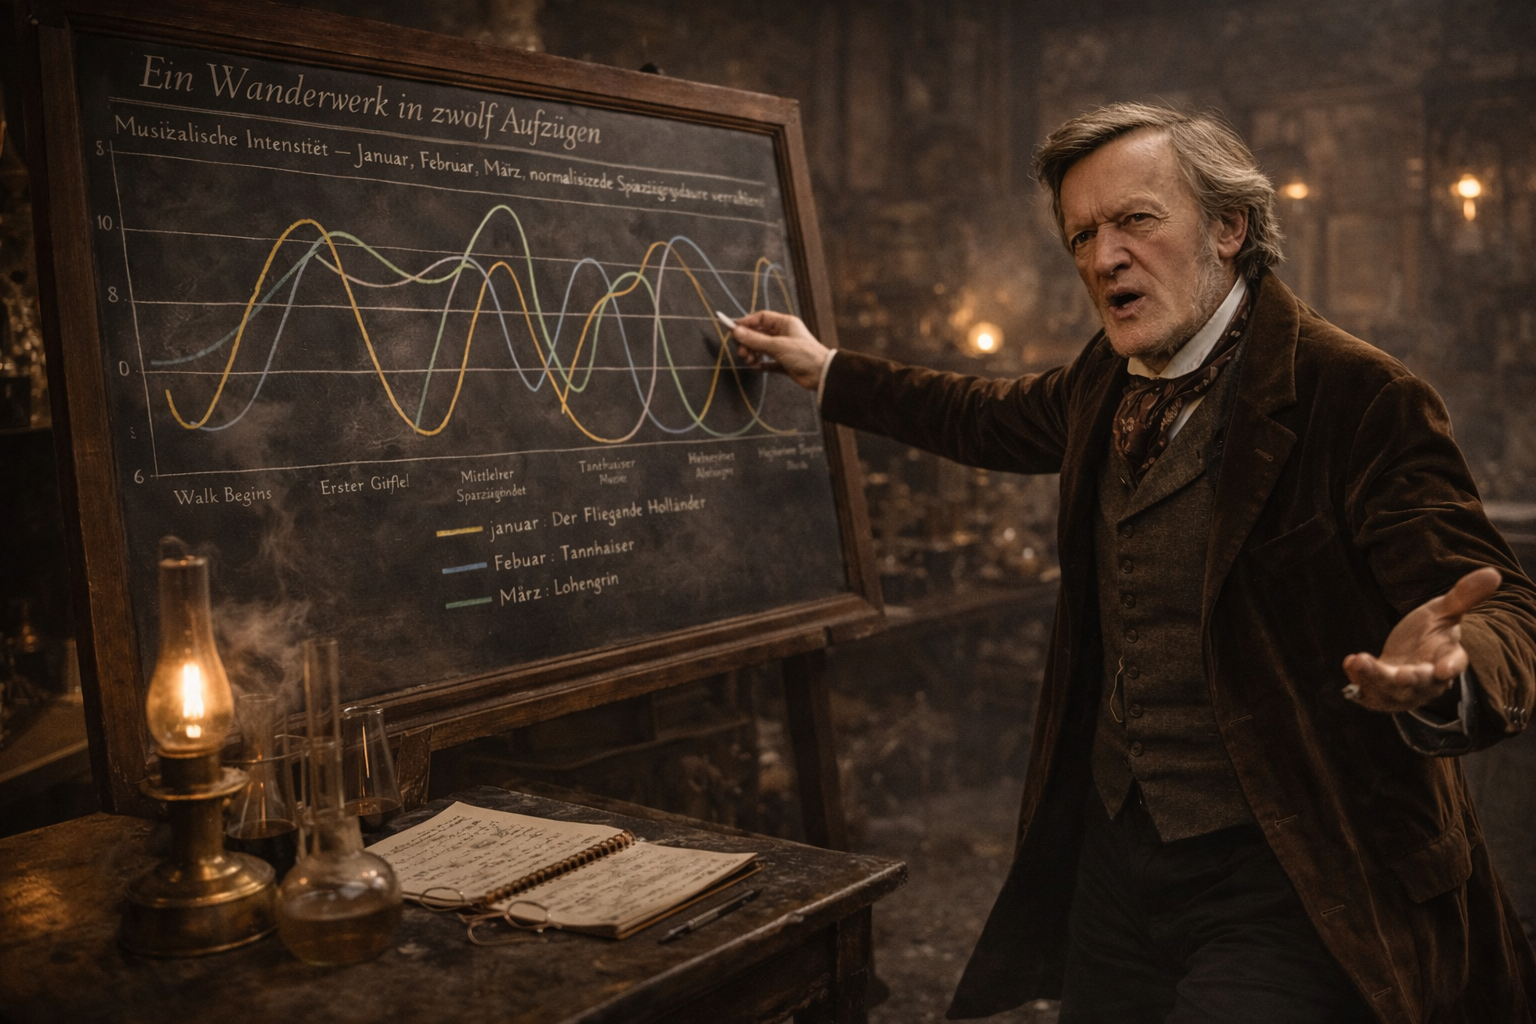
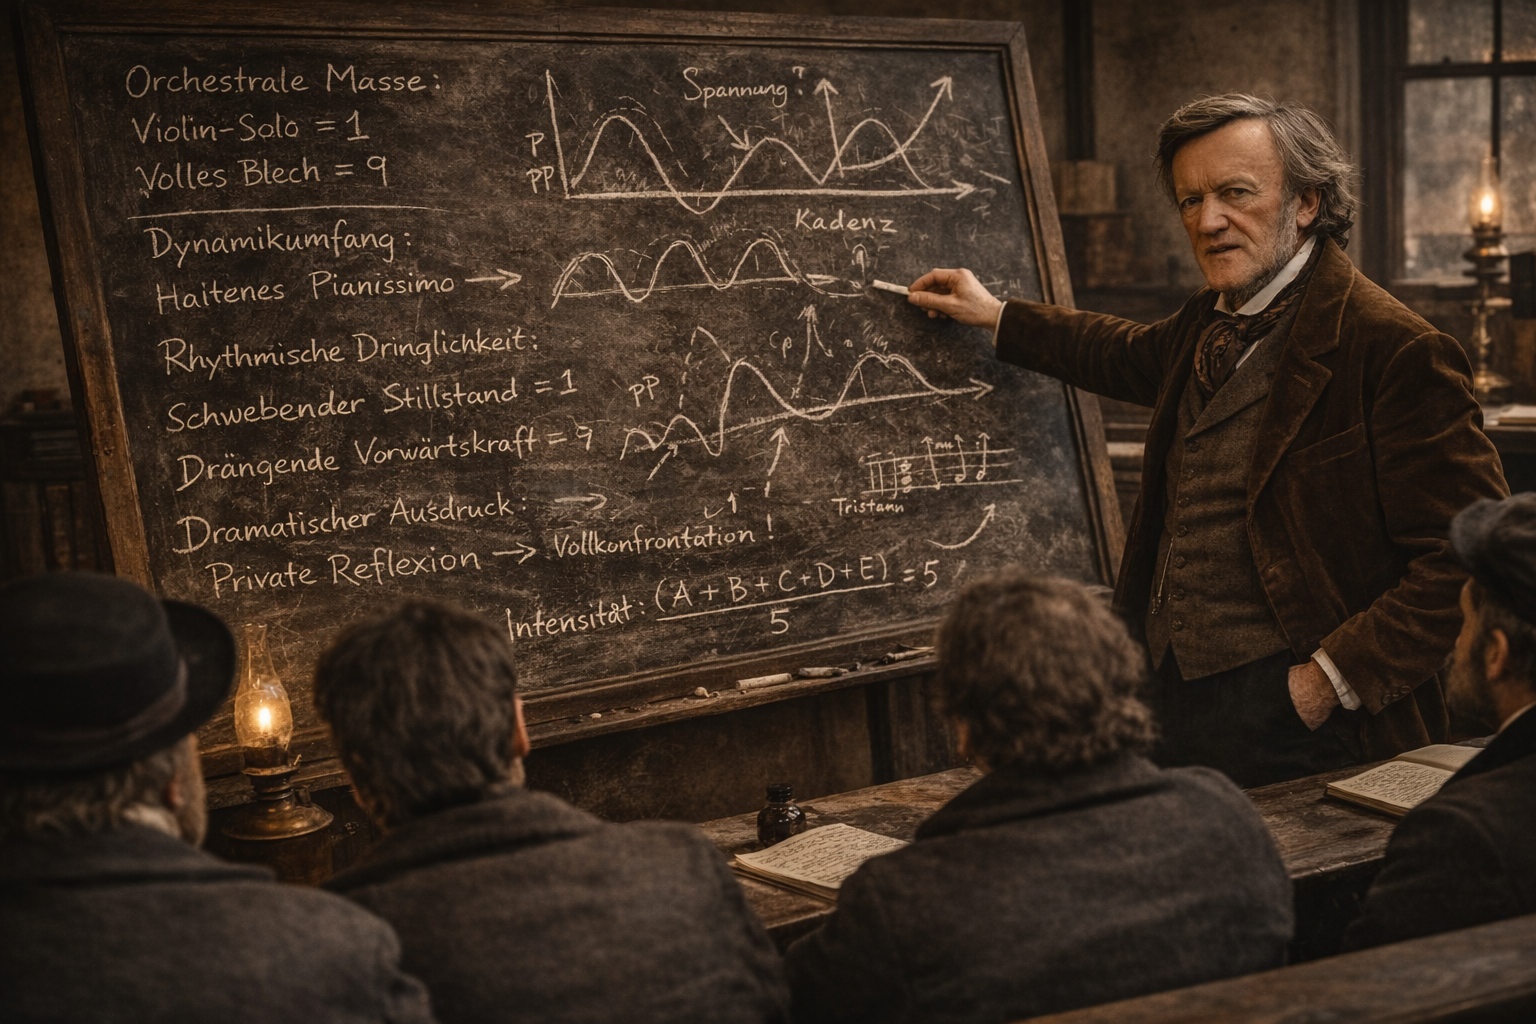
Each location in a walk is scored across five dimensions drawn from Wagner's own compositional practice. The first is orchestral mass. The weight and density of the instrumentation at that moment. A passage for solo violin scores differently from one in which the full brass section enters without warning. The second is dynamic range: the spread between the softest and loudest moments the walker encounters, the distance between a held pianissimo and a fortissimo that carries across open water. The third is rhythmic urgency: the degree of forward propulsion in the music, against the suspension, stasis, or drift that Wagner uses just as deliberately. The fourth is harmonic tension: whether the music sits in unresolved dissonance, in the kind of suspended chromaticism that defines the Tristan chord and much of late Wagner, or whether it moves toward cadential arrival, toward resolution, toward the sense that something has landed. The fifth is dramatic register: the scale of the moment, from intimate soliloquy to full ensemble confrontation, from interior crisis to communal declaration.
These five scores are averaged into a single intensity value for each location. The result is plotted, smoothed into a continuous curve, and read against the sequence of places the walk moves through.
The scoring is not purely musical. It is relational. A location earns its score based on the specific track assigned to it and the particular moment within that track where the walker is instructed to listen. A piece that scores 9 in one context may score 4 in another if the walk calls for its quieter passage, its aftermath, or its deliberate silence. The chart maps experience, not the score in isolation.
Silence as Data
When a walk instructs the walker to remove headphones, or to let music fade without replacement, those moments are assigned the lowest values on the scale. They are not absences in the data. They are structural.
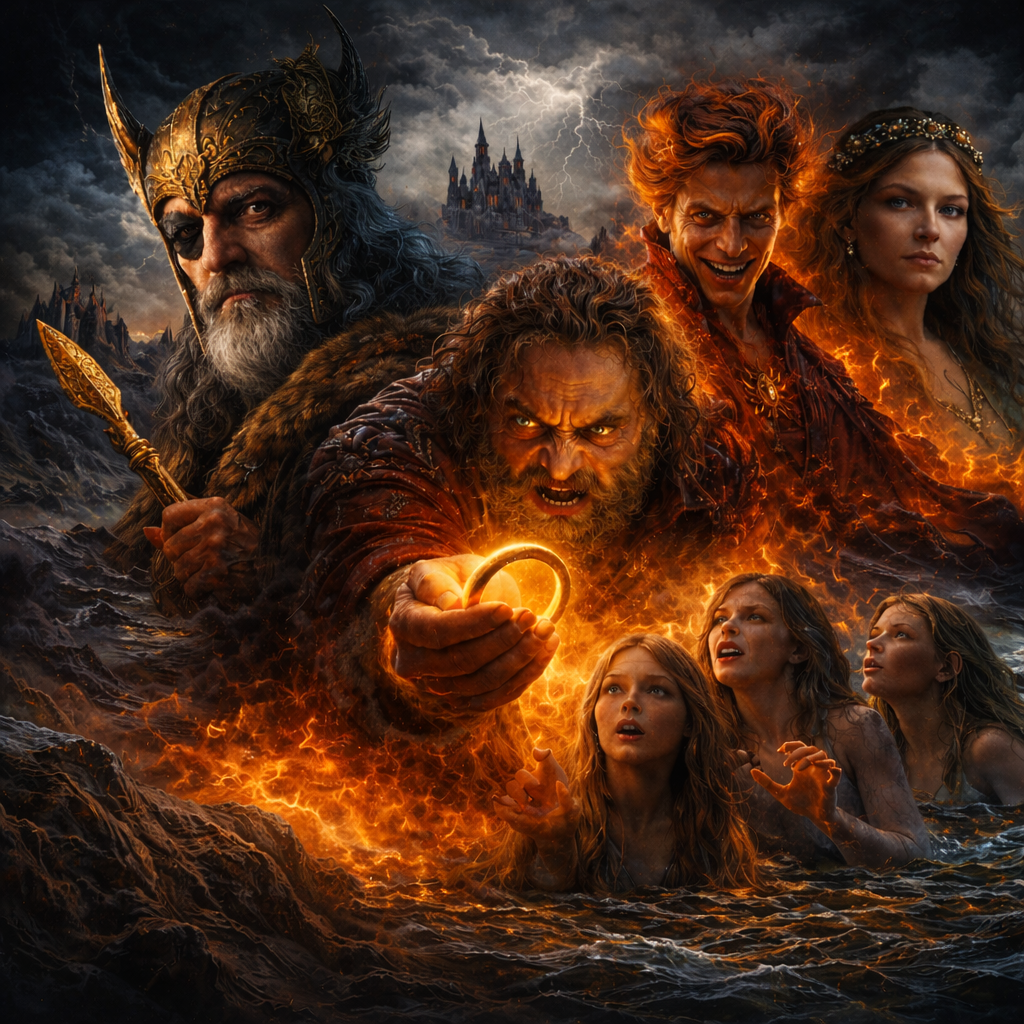
Wagner understood silence as compositional material. The pause before the Dutchman's aria. The gap between the close of the Prelude and the entry of the chorus. The moment in the Lohengrin Prelude when the opening texture seems to thin into nothing before the revelation. These silences have weight. The charts treat them accordingly.
The January walk drops to 1 twice. Once in the middle of the harbor crossing, when the walk explicitly instructs a period of silence between the end of Die Frist ist um and the overture reprise on the return leg. Once at the very end, at Wagner Park, when the instruction is to stand without headphones and listen to harbor noise and ferry horns. Both zeroes are earned. Both are load-bearing.
If you removed them from the chart, the shape would read differently. It would look like a walk that simply accumulates intensity and then dissipates. The silences are what give the curve its structure. They are the rests in the bar.
What the January Curve Says
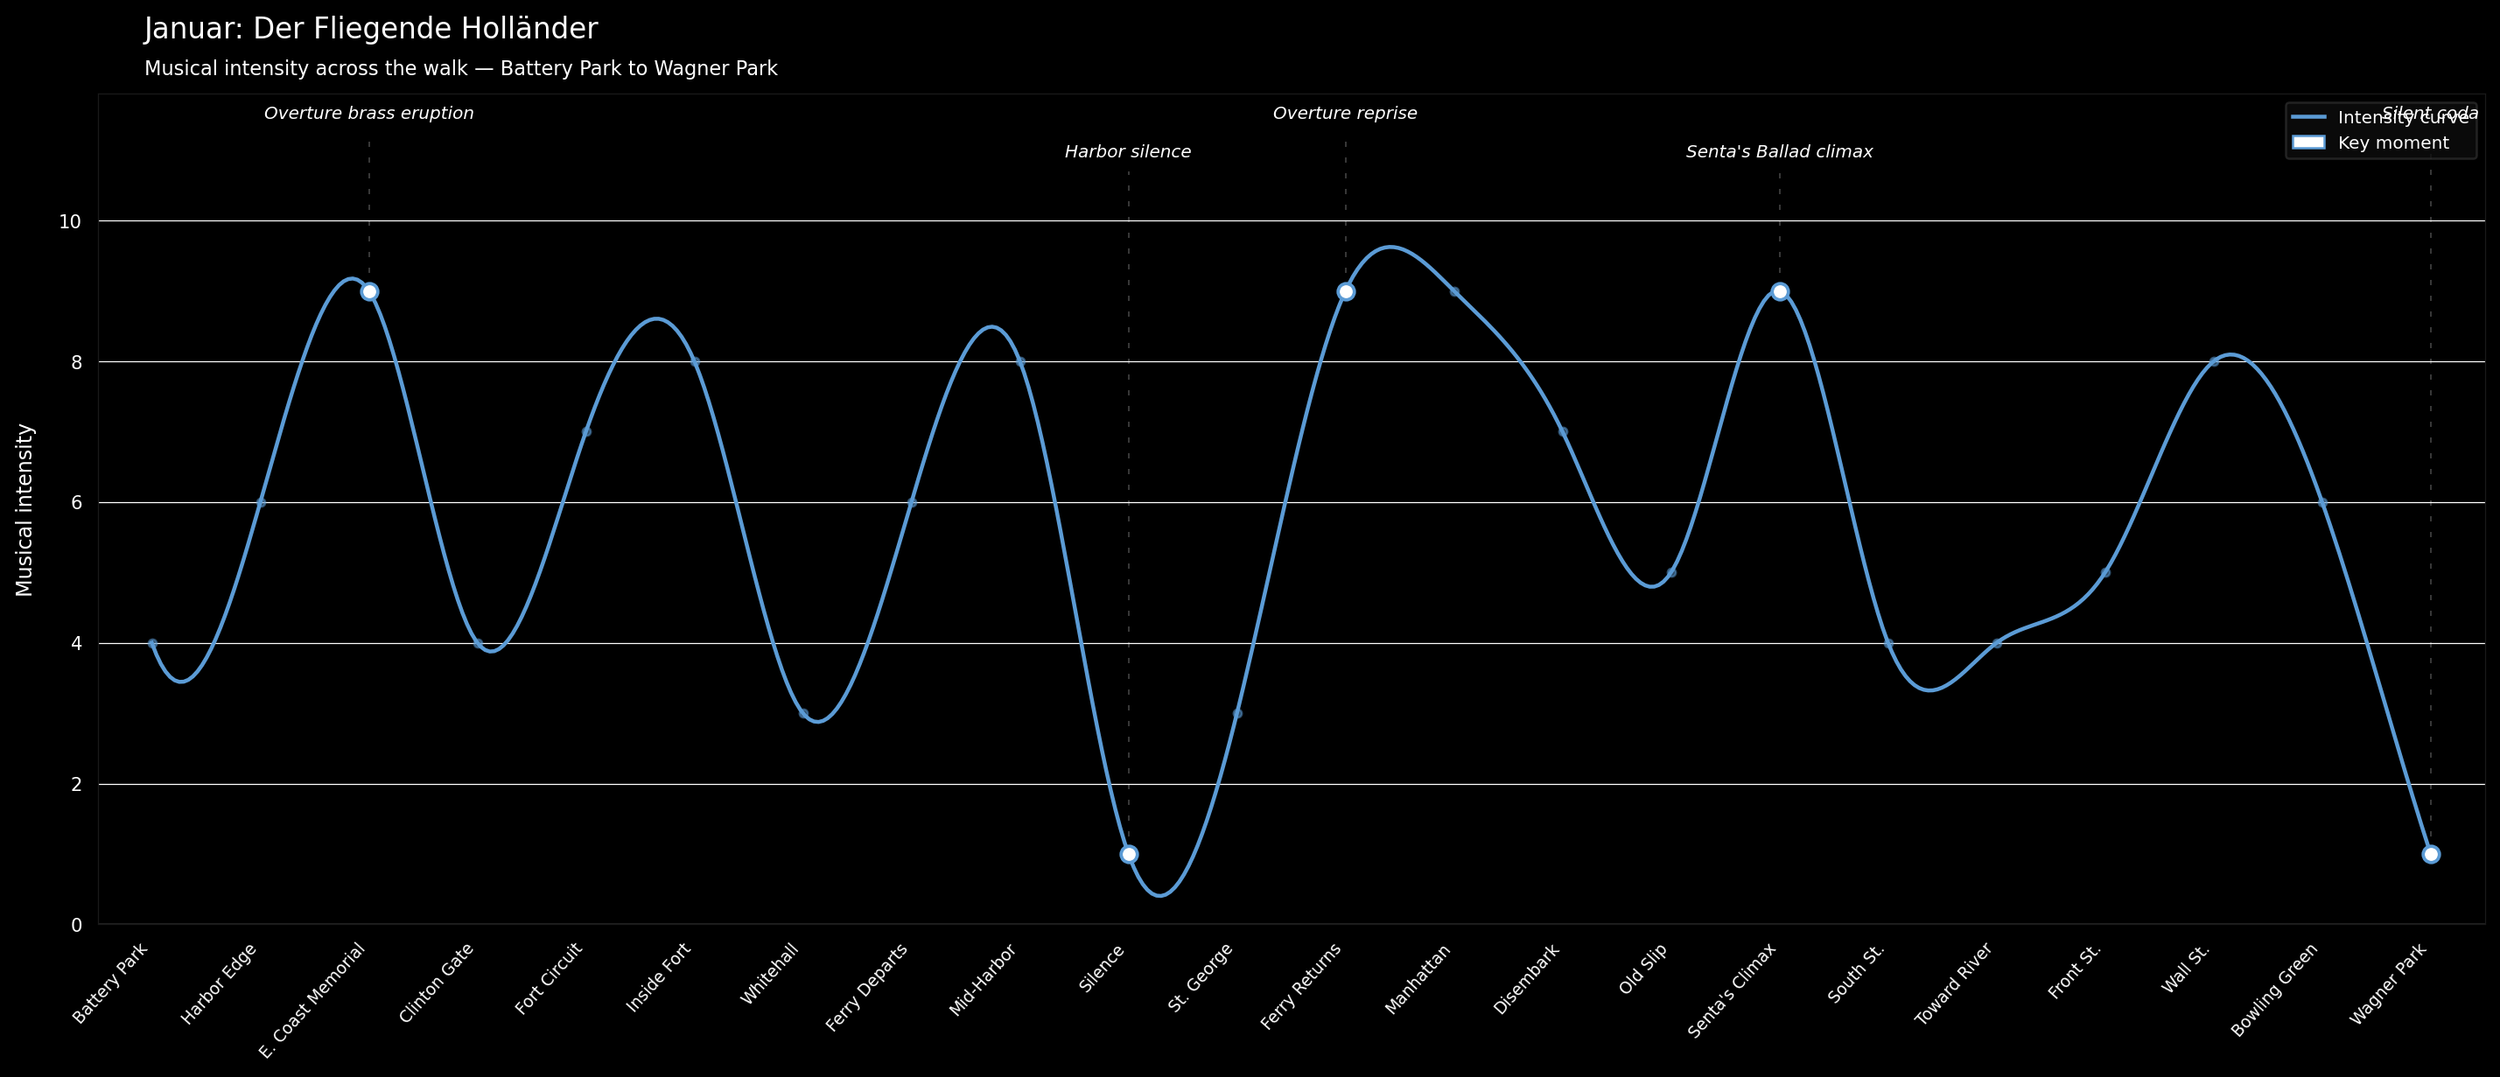
The Holländer chart has a quality that took several viewings to name. It looks like a sea state. The line rises and falls in a pattern that is neither random nor symmetrical, but organic, the way actual water moves. A swell, a trough, another swell slightly larger than the first, a long flat, a peak, a drop, a second peak of equal height, and then the long descent to silence.
This is not accidental. The overture is itself a storm psychology. Wagner described his experience of the actual sea crossing from Riga to London in 1839 in precisely these terms: not a single event but a sustained alternation between force and deceptive lull. The walk is structured to enact that alternation in physical space. The harbor edge and Castle Clinton carry the overture's opening energy. The ferry crossing carries the Dutchman's monologue, which is its own interior storm. The Wall Street micro-loop carries the overture again, but now the music has been reframed by everything the walk has passed through.
What the chart reveals is that January is a walk about recurrence rather than progression. The two 9-point peaks are nearly identical in height. The curve does not climb toward a resolution it never achieves. It loops. This is the Dutchman's condition made visible as data. The ship that cannot stop sailing. The score that cannot finally cadence.
What the February Curve Says
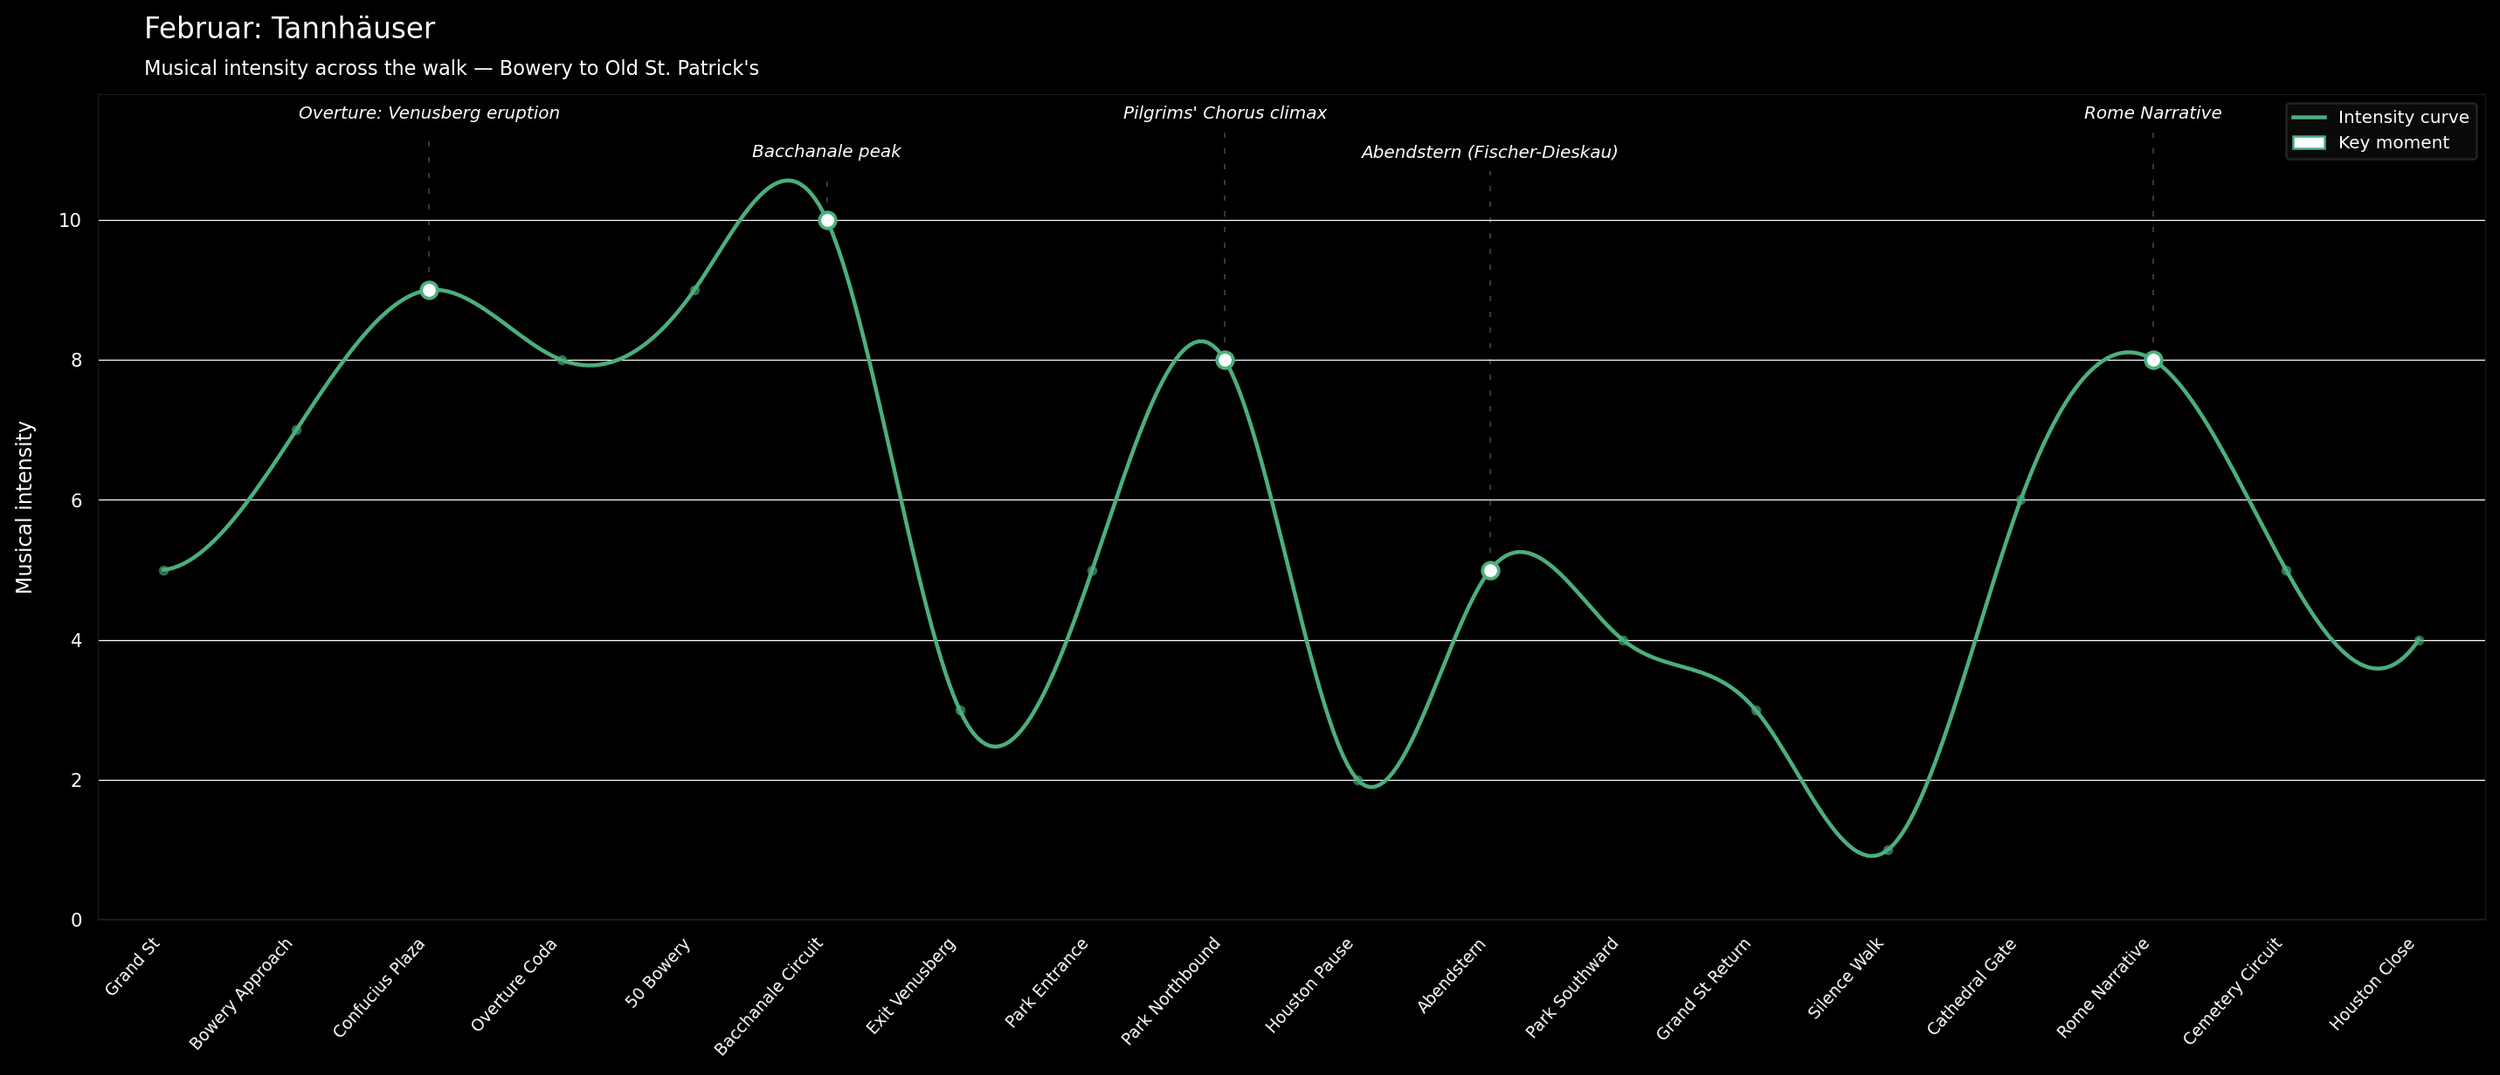
The Tannhäuser chart front-loads its energy in a way that is immediately legible. The Bacchanale circuit peaks at 10, the only walk in the first quarter to reach the top of the scale, and it does so before the walk has reached its halfway point. Everything that follows is, in structural terms, a management of that excess.
This matches the opera's own logic. Tannhäuser's problem is not that he cannot feel intensity, but that he has felt it at a level the social world cannot accommodate. The Song Contest scene, the Rome pilgrimage, the final collapse, all of these are the opera trying and failing to metabolise what Act I released. The walk enacts this by placing the Bowery's Venusberg energy early and then spending the rest of its length in gradual descent, with two partial recoveries: the Pilgrims' Chorus in Sara D. Roosevelt Park, and the Rome Narrative at Old St. Patrick's.
Neither recovery reaches the Bacchanale's height. The chart makes this visible as a kind of irresolution that is also a faithful reading of the opera. Tannhäuser does not resolve. He exhausts himself against the problem. The curve's shape is the shape of that exhaustion.
There is also a detail that only becomes visible in the chart and not in the walk guide: the Bacchanale's 10 is preceded by a 9 at Confucius Plaza. The walk builds to its peak across two consecutive locations rather than arriving at it cold. This matters because it corresponds to the overture's own structure, the collision and escalation of sacred and sensual themes, before the Bacchanale proper confirms what the overture was preparing. The chart catches this buildup in a way the guide's prose does not make explicit.
What the March Curve Says
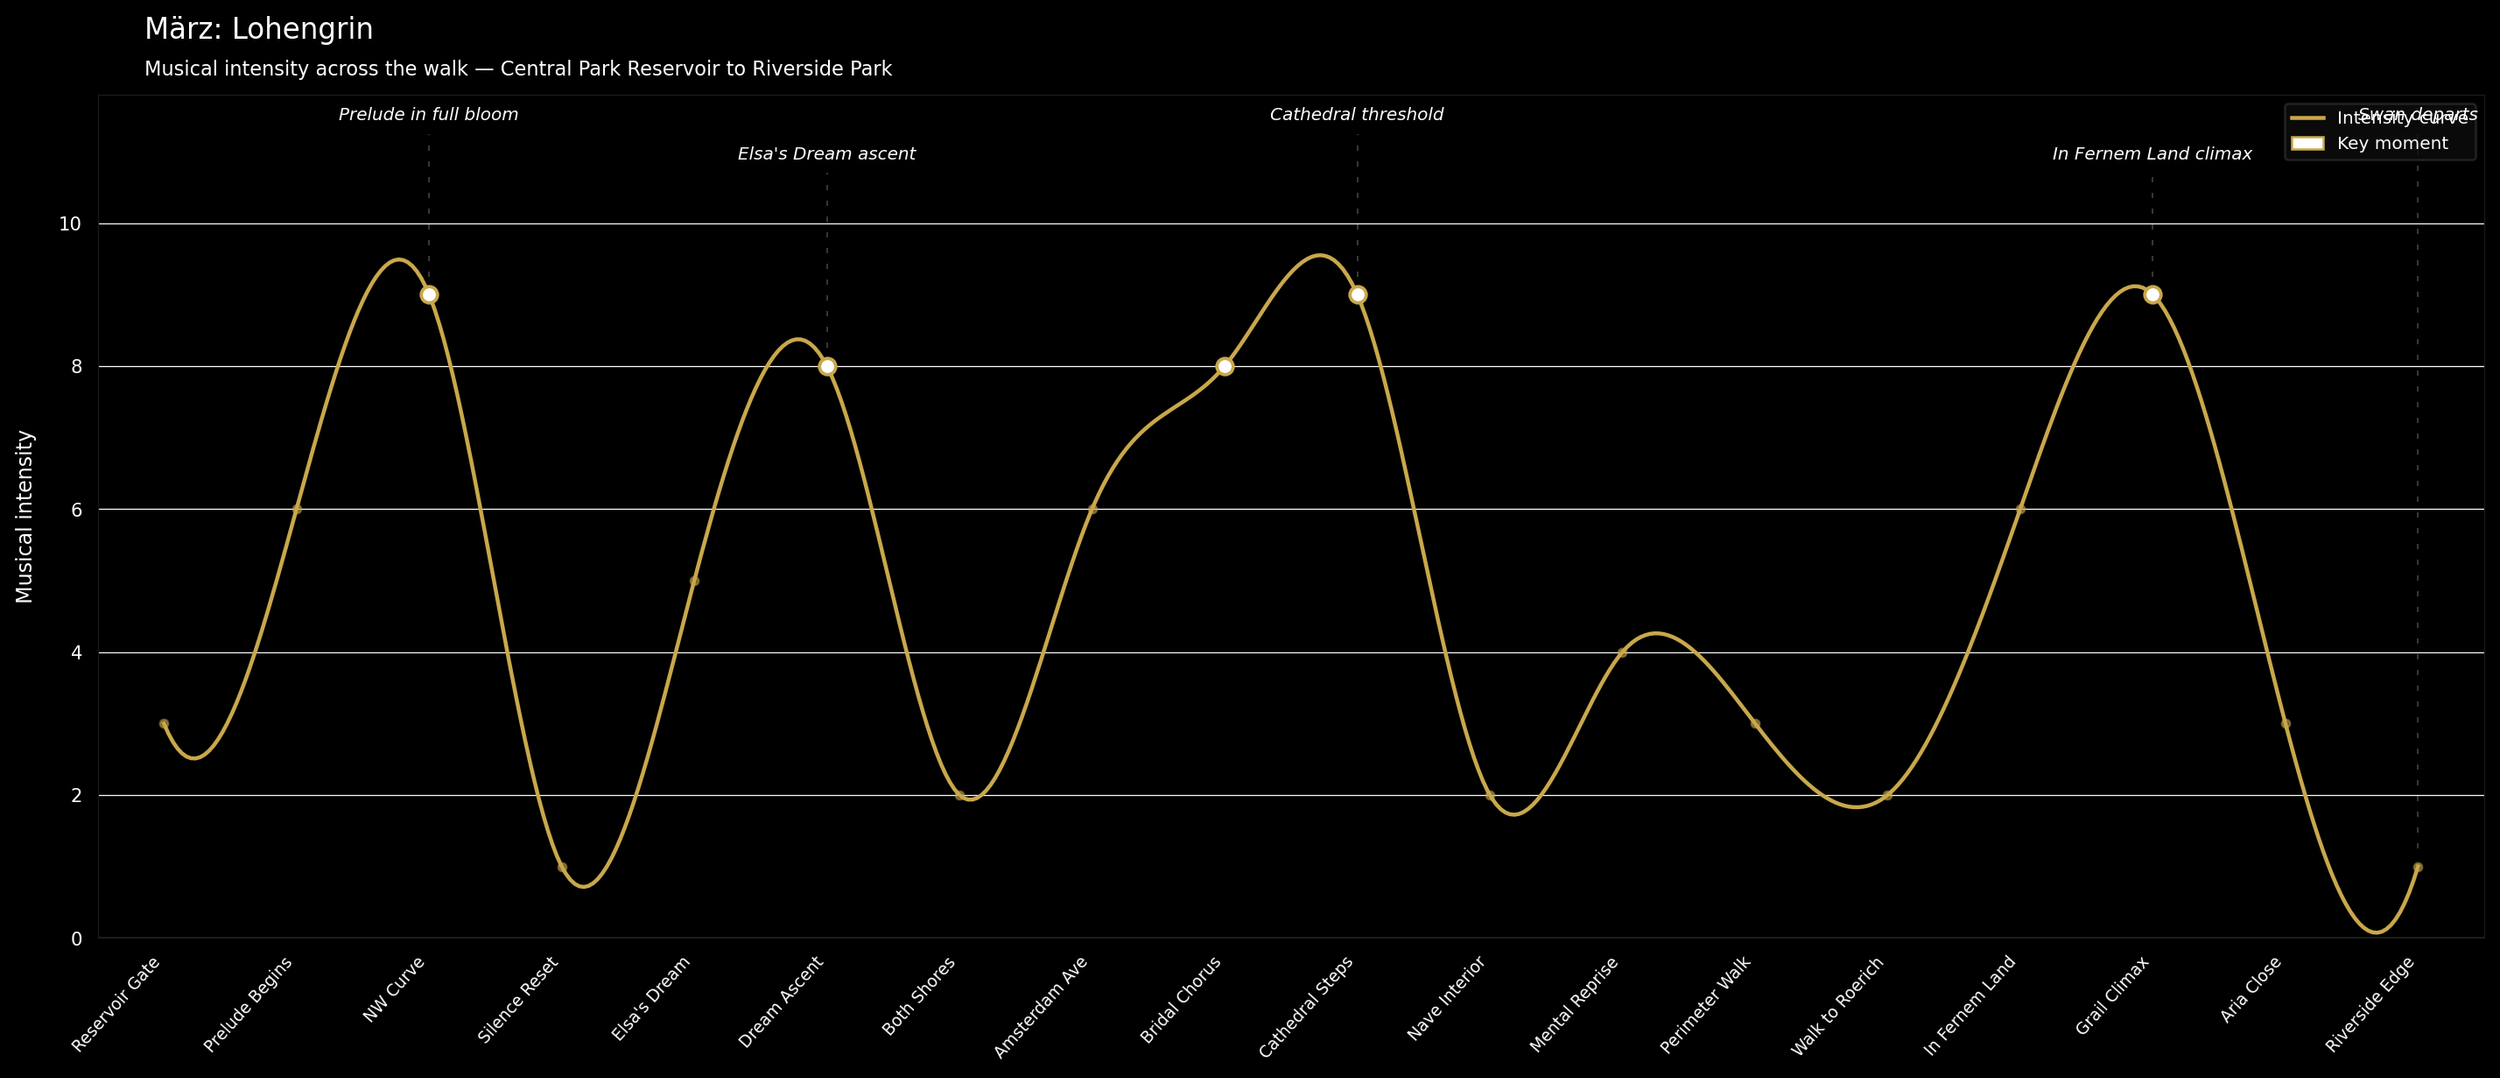
The Lohengrin chart is the most formally complex of the three, and the most surprising. Where January loops and February front-loads, March doubles. The curve produces two distinct arches, each rising to a 9-point peak, separated by a deep valley. The first arch belongs to the Prelude and Elsa's Dream at the reservoir. The second belongs to the Bridal Chorus and the cathedral threshold, followed by In Fernem Land at the Roerich Museum.
These two arches correspond to the opera's two modes of promise. The first is the promise of arrival: the swan boat visible in mist, the knight who might come. The second is the promise of revelation: the knight who has arrived naming himself, explaining where he came from, and in doing so, dissolving the condition that made his presence possible.
The valley between the two arches is the cathedral interior. When the walk enters St. John the Divine, it instructs silence. No track. A mental reprise only, sitting in the nave, letting the music play internally without external confirmation. The score at that point drops to 2. This is not a compositional failure in the walk. It is precisely where the walk is most Wagnerian. Lohengrin's power depends on the absence of explanation. The moment of interior silence in the cathedral, surrounded by the architectural apparatus of belief, is the closest the walk comes to staging what trust actually feels like as a physical experience.
The second arch then rises out of that silence. The walk earns its second peak at Roerich because it has passed through the cathedral's deliberate quiet. Without the valley, the two summits would read as repetition. With it, they read as the two movements of the opera: promise given, and promise recalled.
The Combined Chart
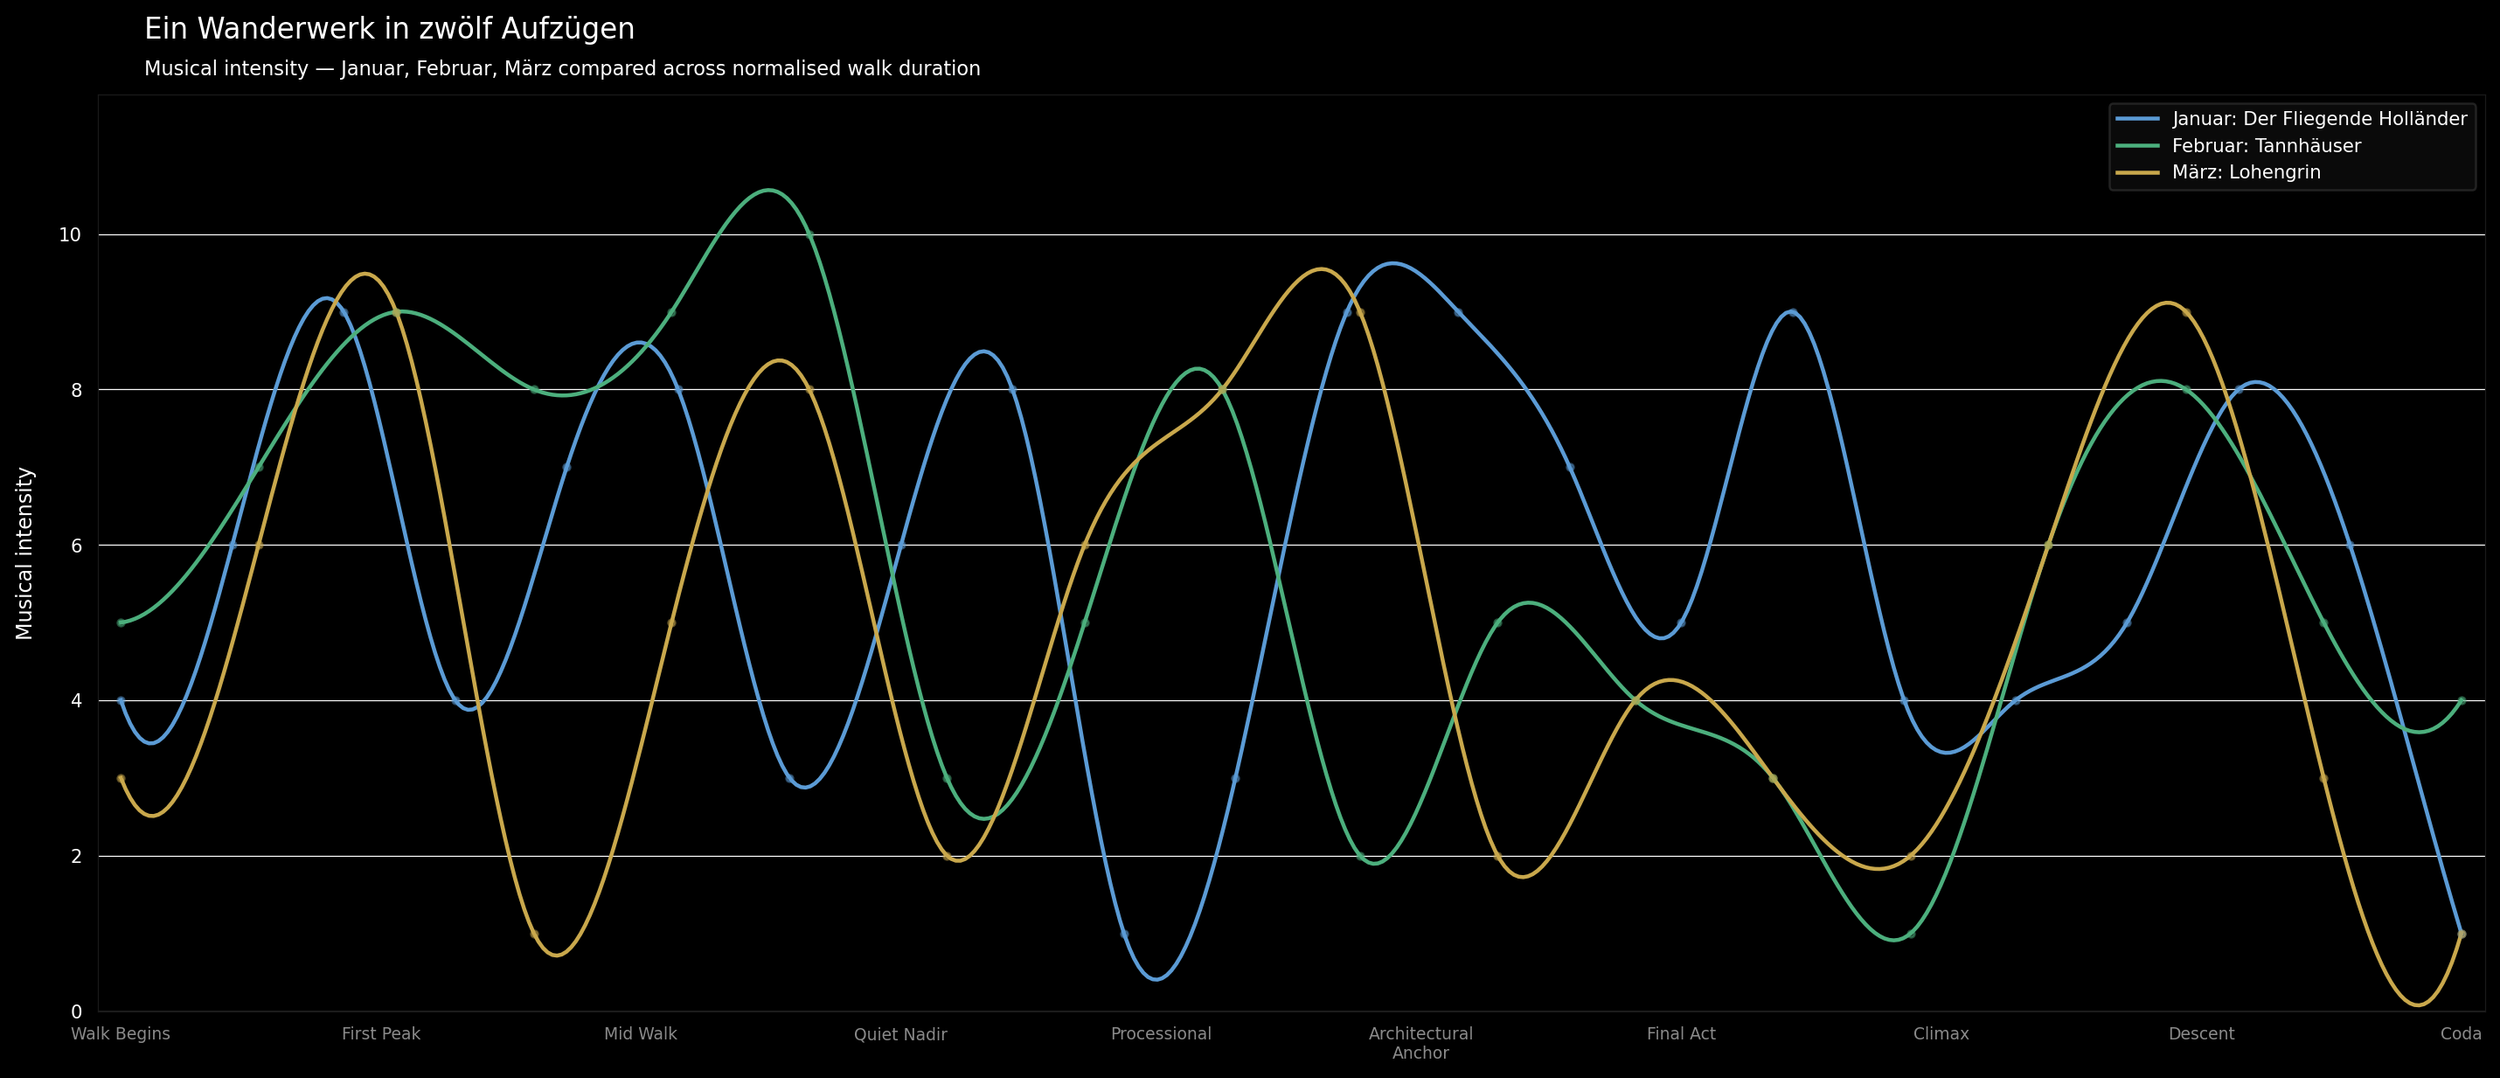
When the three curves are placed on a single chart, normalised to occupy the same horizontal span, a broader argument becomes visible.
Each walk begins at a different intensity level, and each ends at silence. January starts at a 4 and ends at 1. February starts at a 5 and ends at 4 before its final descent. March starts at a 3 and ends at 1. The openings are tentative. The walks do not begin at full force. They require the city to warm them up.
The most striking feature of the combined chart is the divergence in the first third. By the point that corresponds to roughly one-third of the walk's duration, February is already at its maximum, January is climbing toward its first major peak, and March is in its post-Prelude silence trough. Three different relationships to the question of when the music should arrive at its most demanding. Three different answers to what an opera asks of a body moving through a city.
The combined chart also reveals something about the project as a whole that is not yet visible in any individual walk. The three operas chosen for the first quarter are the three that Wagner himself grouped together as his Romantic operas, the works written before the Ring changed everything. They share a preoccupation with the outsider who arrives from elsewhere and must negotiate the terms of belonging. The Dutchman from the sea. Tannhäuser from the grotto. Lohengrin from the Grail realm. Each of them is a figure of conditional presence. Each curve ends at silence or near it. Each walk closes without resolution.
This is not an accident of scoring. It is what these operas are. And it is what New York, at least in the first three months of the year, keeps insisting on in return. The charts will continue as the year proceeds. April's Tristan will not behave like any of these three. Its harmonic world is different in kind, not just degree, and the walks designed around it operate differently. The curve for that month may not resolve at all. It may simply dissolve. That seems right. Some music cannot be charted without remainder. The remainder is what we're walking toward.
Further Reading